Energy Systems
Renewable Energy System Simulation
Simulation and techno-economic analysis of a rooftop solar PV array and an 87-turbine wind farm — from hourly generation to levelized cost of energy.
Overview
Part of my minor in Sustainable Energy, this project modelled two real renewable systems end to end — rooftop solar and utility-scale wind — to see what they actually deliver and what the energy costs.
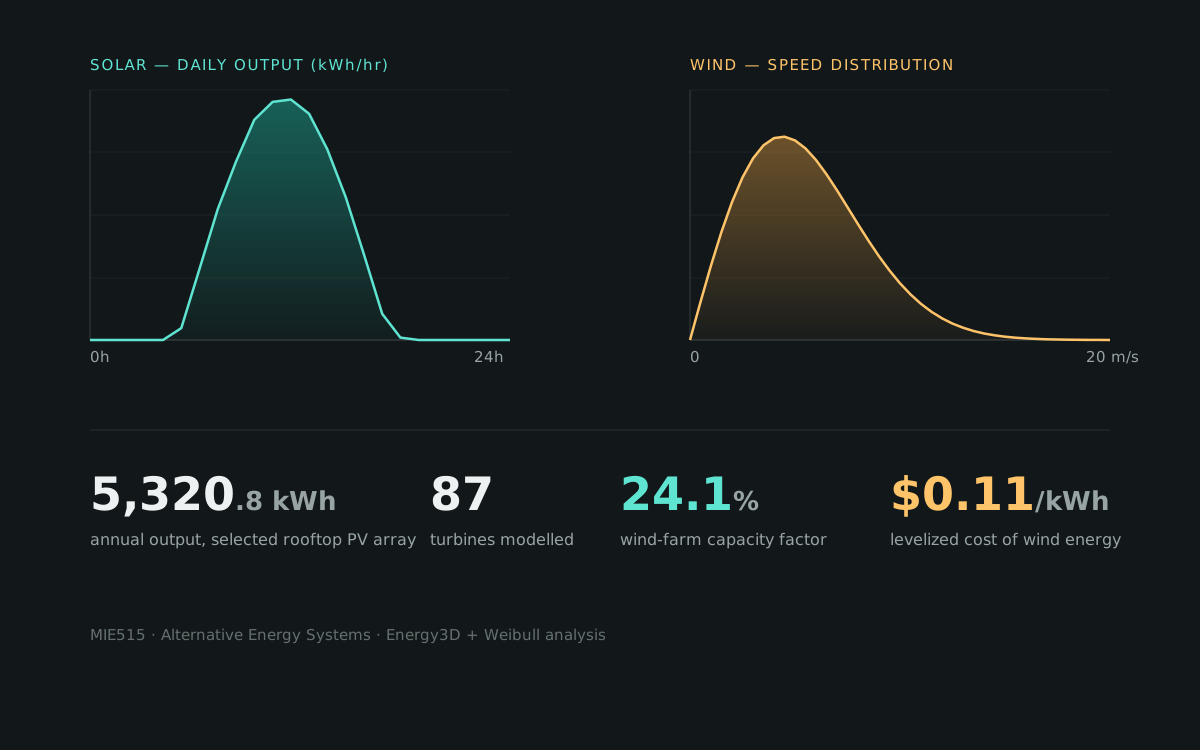
For solar, I modelled rooftop PV arrays in Energy3D, computing hourly output on representative days and across a full year for flat and tilted configurations, then swept the panel tilt to maximize annual yield. The selected four-panel array produced 5,320 kWh per year.
For wind, I fit a Weibull distribution to a year of measured wind-farm data, calculated per-turbine and 87-turbine annual energy and a 24.1% capacity factor, then built a levelized-cost model — arriving at $0.11/kWh with sensitivity analysis across project life, maintenance, and required rate of return.
Scope of work
- Modelled rooftop PV arrays (flat and tilted) in Energy3D, hourly to annual
- Swept panel tilt to maximize yearly generation
- Fit a Weibull wind-speed distribution to measured farm data
- Built a levelized-cost-of-energy model with sensitivity analysis